Smart Tag Analysis
The Smart Tag Analysis shows the proportion of samples that have been tagged by each smart tag family, broken down by prediction outcomes, along with sample counts and prediction accuracies. If no pipeline is selected, only the sample count will be available.
The analyses associated with each smart tag family may also be associated with
a specific model behavior, failure mode, and/or approach to address any issues. For example,
Dissimilar smart tags are associated with class definition issues, such as class overlap, and
may require actions such as relabeling training samples or augmenting the training data.
Partial Syntax smart tags can help you assess whether any syntactical
patterns are associated with greater misclassification, which might warrant data
augmentation.
To further explore a pattern, including investigating individual samples and smart tags,
click on a bar to go to the exploration space with the corresponding filters applied. This can
help guide any actions required to address a problem. For example, examining misclassified
samples tagged no_close_train can help direct targeted data augmentation, if necessary.
Smart Tags in Key Concepts gives information on the smart tags included in each smart tag family, with links to more information on the analyses associated with each.
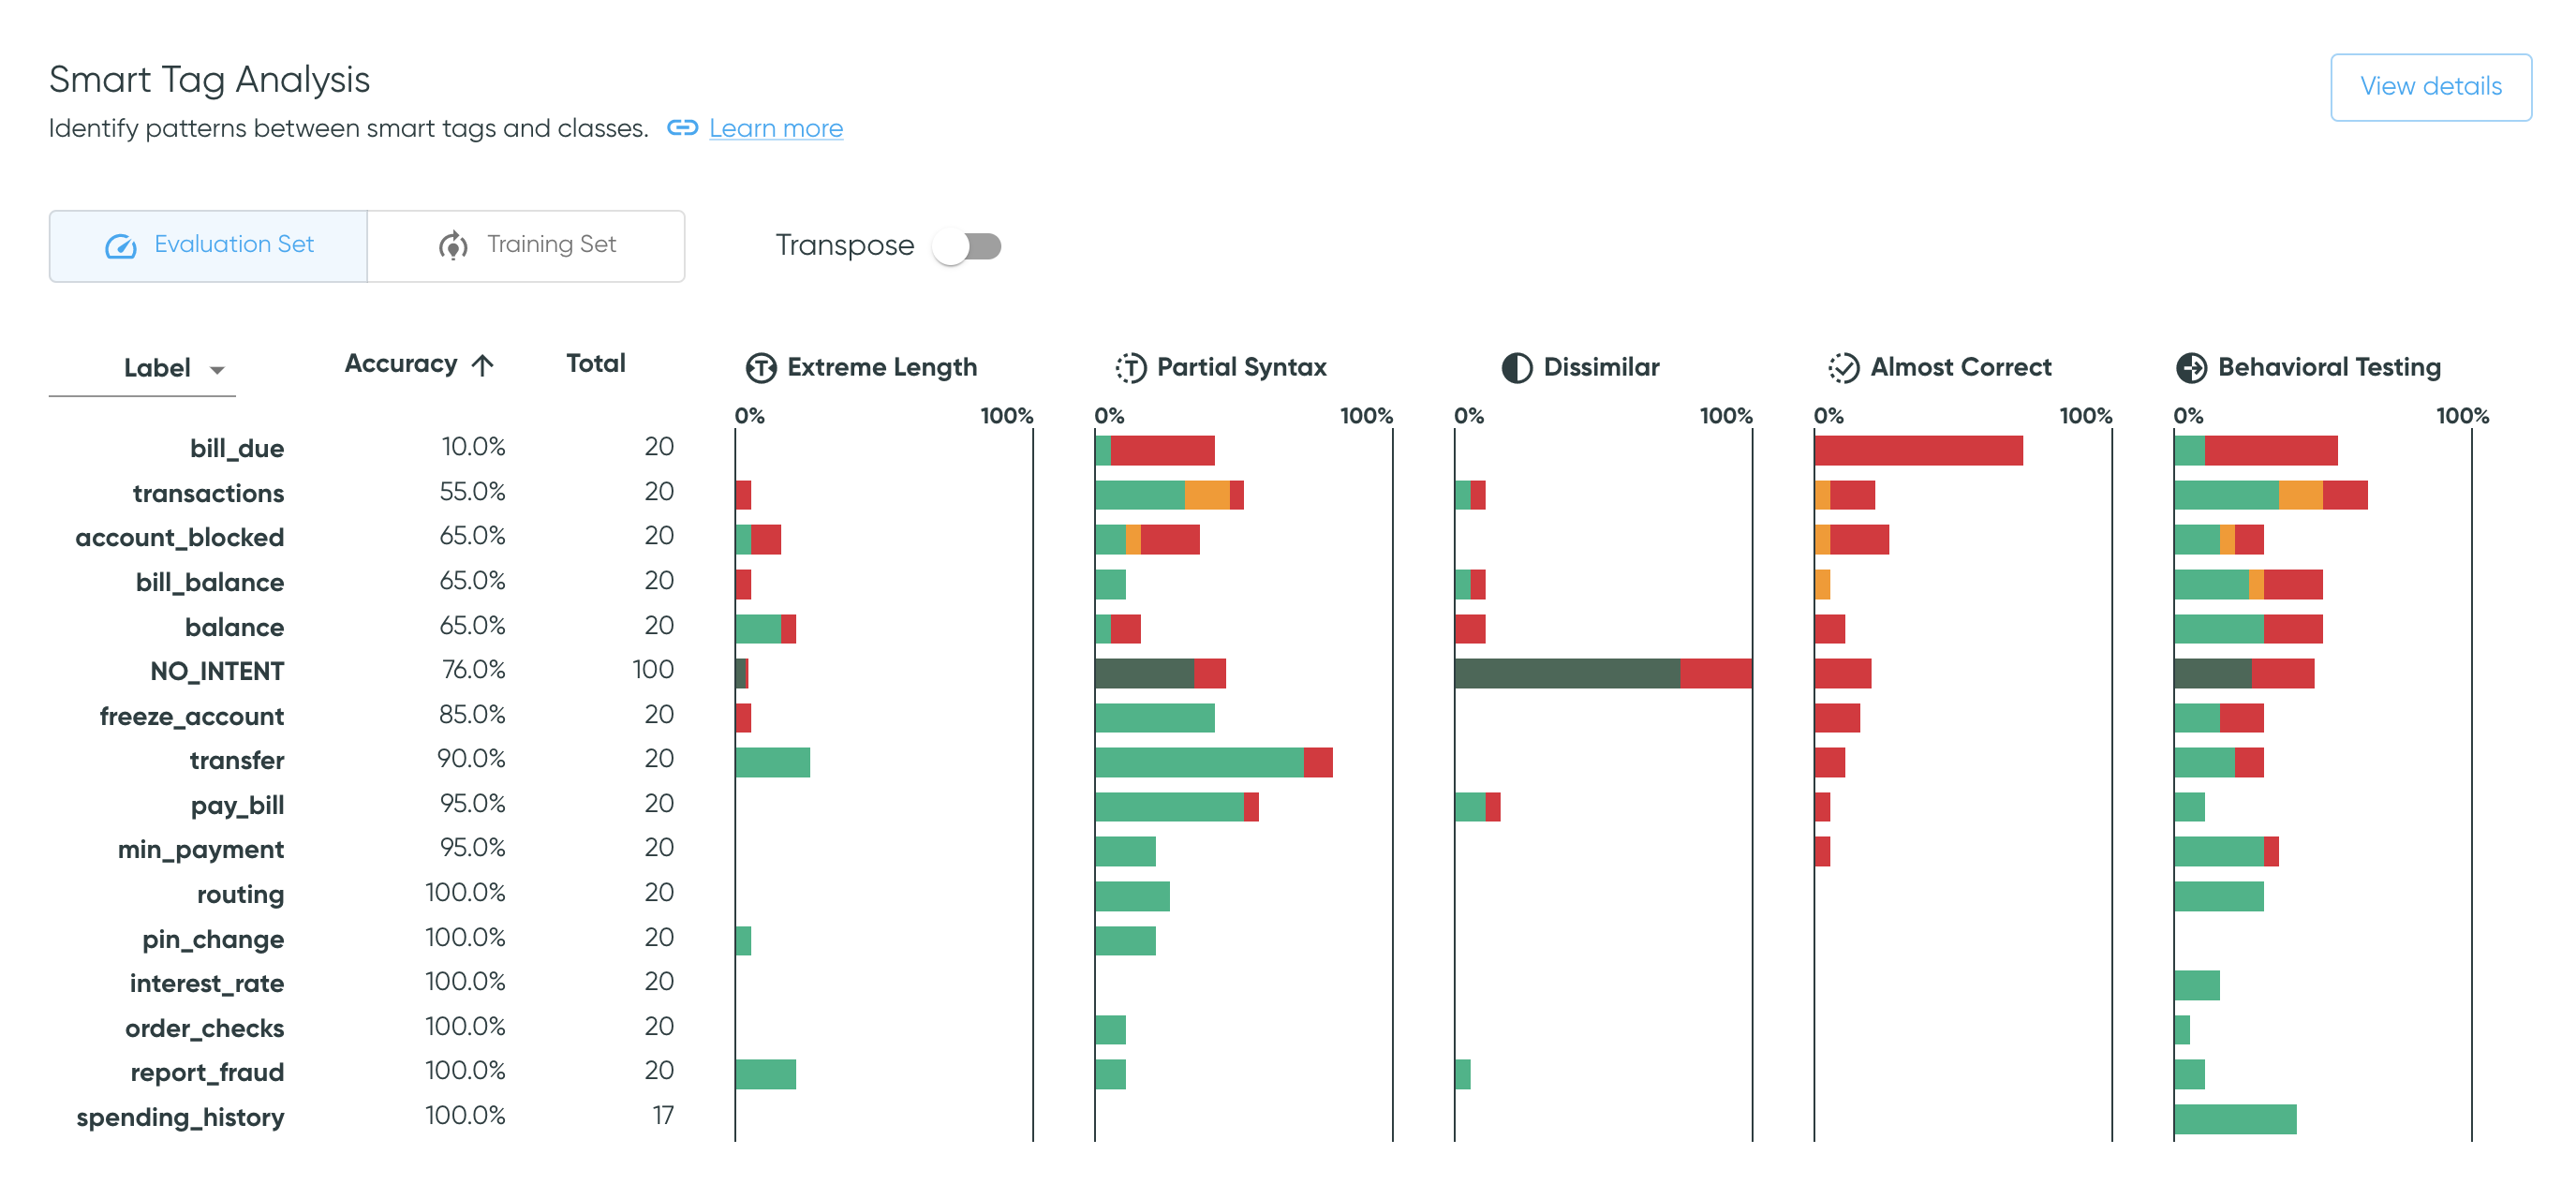
Table Details
The table is described in the default view; in the transposed view, references to columns should be interpreted as references to rows.
Table controls
- Use the toggle to alternate between the training and evaluation sets.
- The
Transposetoggle transposes the table and thus the axes for each bar plot.- The default view aides analysis of each smart tag across all classes, which may be a good starting point for assessing overall dataset and pipeline patterns.
- In contrast, the transposed view groups bars for each class on its own axis. This makes it easier to investigate patterns for a specific class that has been identified as needing further analysis, such as one with greater misclassification rates.
Columns
- The first column shows the class variable for which other values are presented. Use the dropdown to switch between labels, predictions and outcomes.
- The second and third columns show sample count and pipeline accuracy, which can help with identifying or prioritizing classes to investigate. For example, you may want to sort by accuracy in ascending order, to focus on classes for which the model had more difficulty.
- The remaining columns show bar plots across the selected class variable for each smart tag family. Colors indicate prediction outcomes, and column sorting acts on the full stacked bar.