Similarity Analysis
What is it?
Similarity analysis is based on the relative locations of utterances in embedding space. This analysis can be quite powerful given that no trained ML model is needed; only a dataset needs to be supplied.
Within Azimuth, different similarity analyses are provided to determine how similar utterances are within a class, between classes, and so on. This can help indicate whether classes are well-defined, or whether changes should be made to improve the dataset, such as by redefining classes, relabeling or omitting data, or augmenting the dataset.
Where is this used in Azimuth?
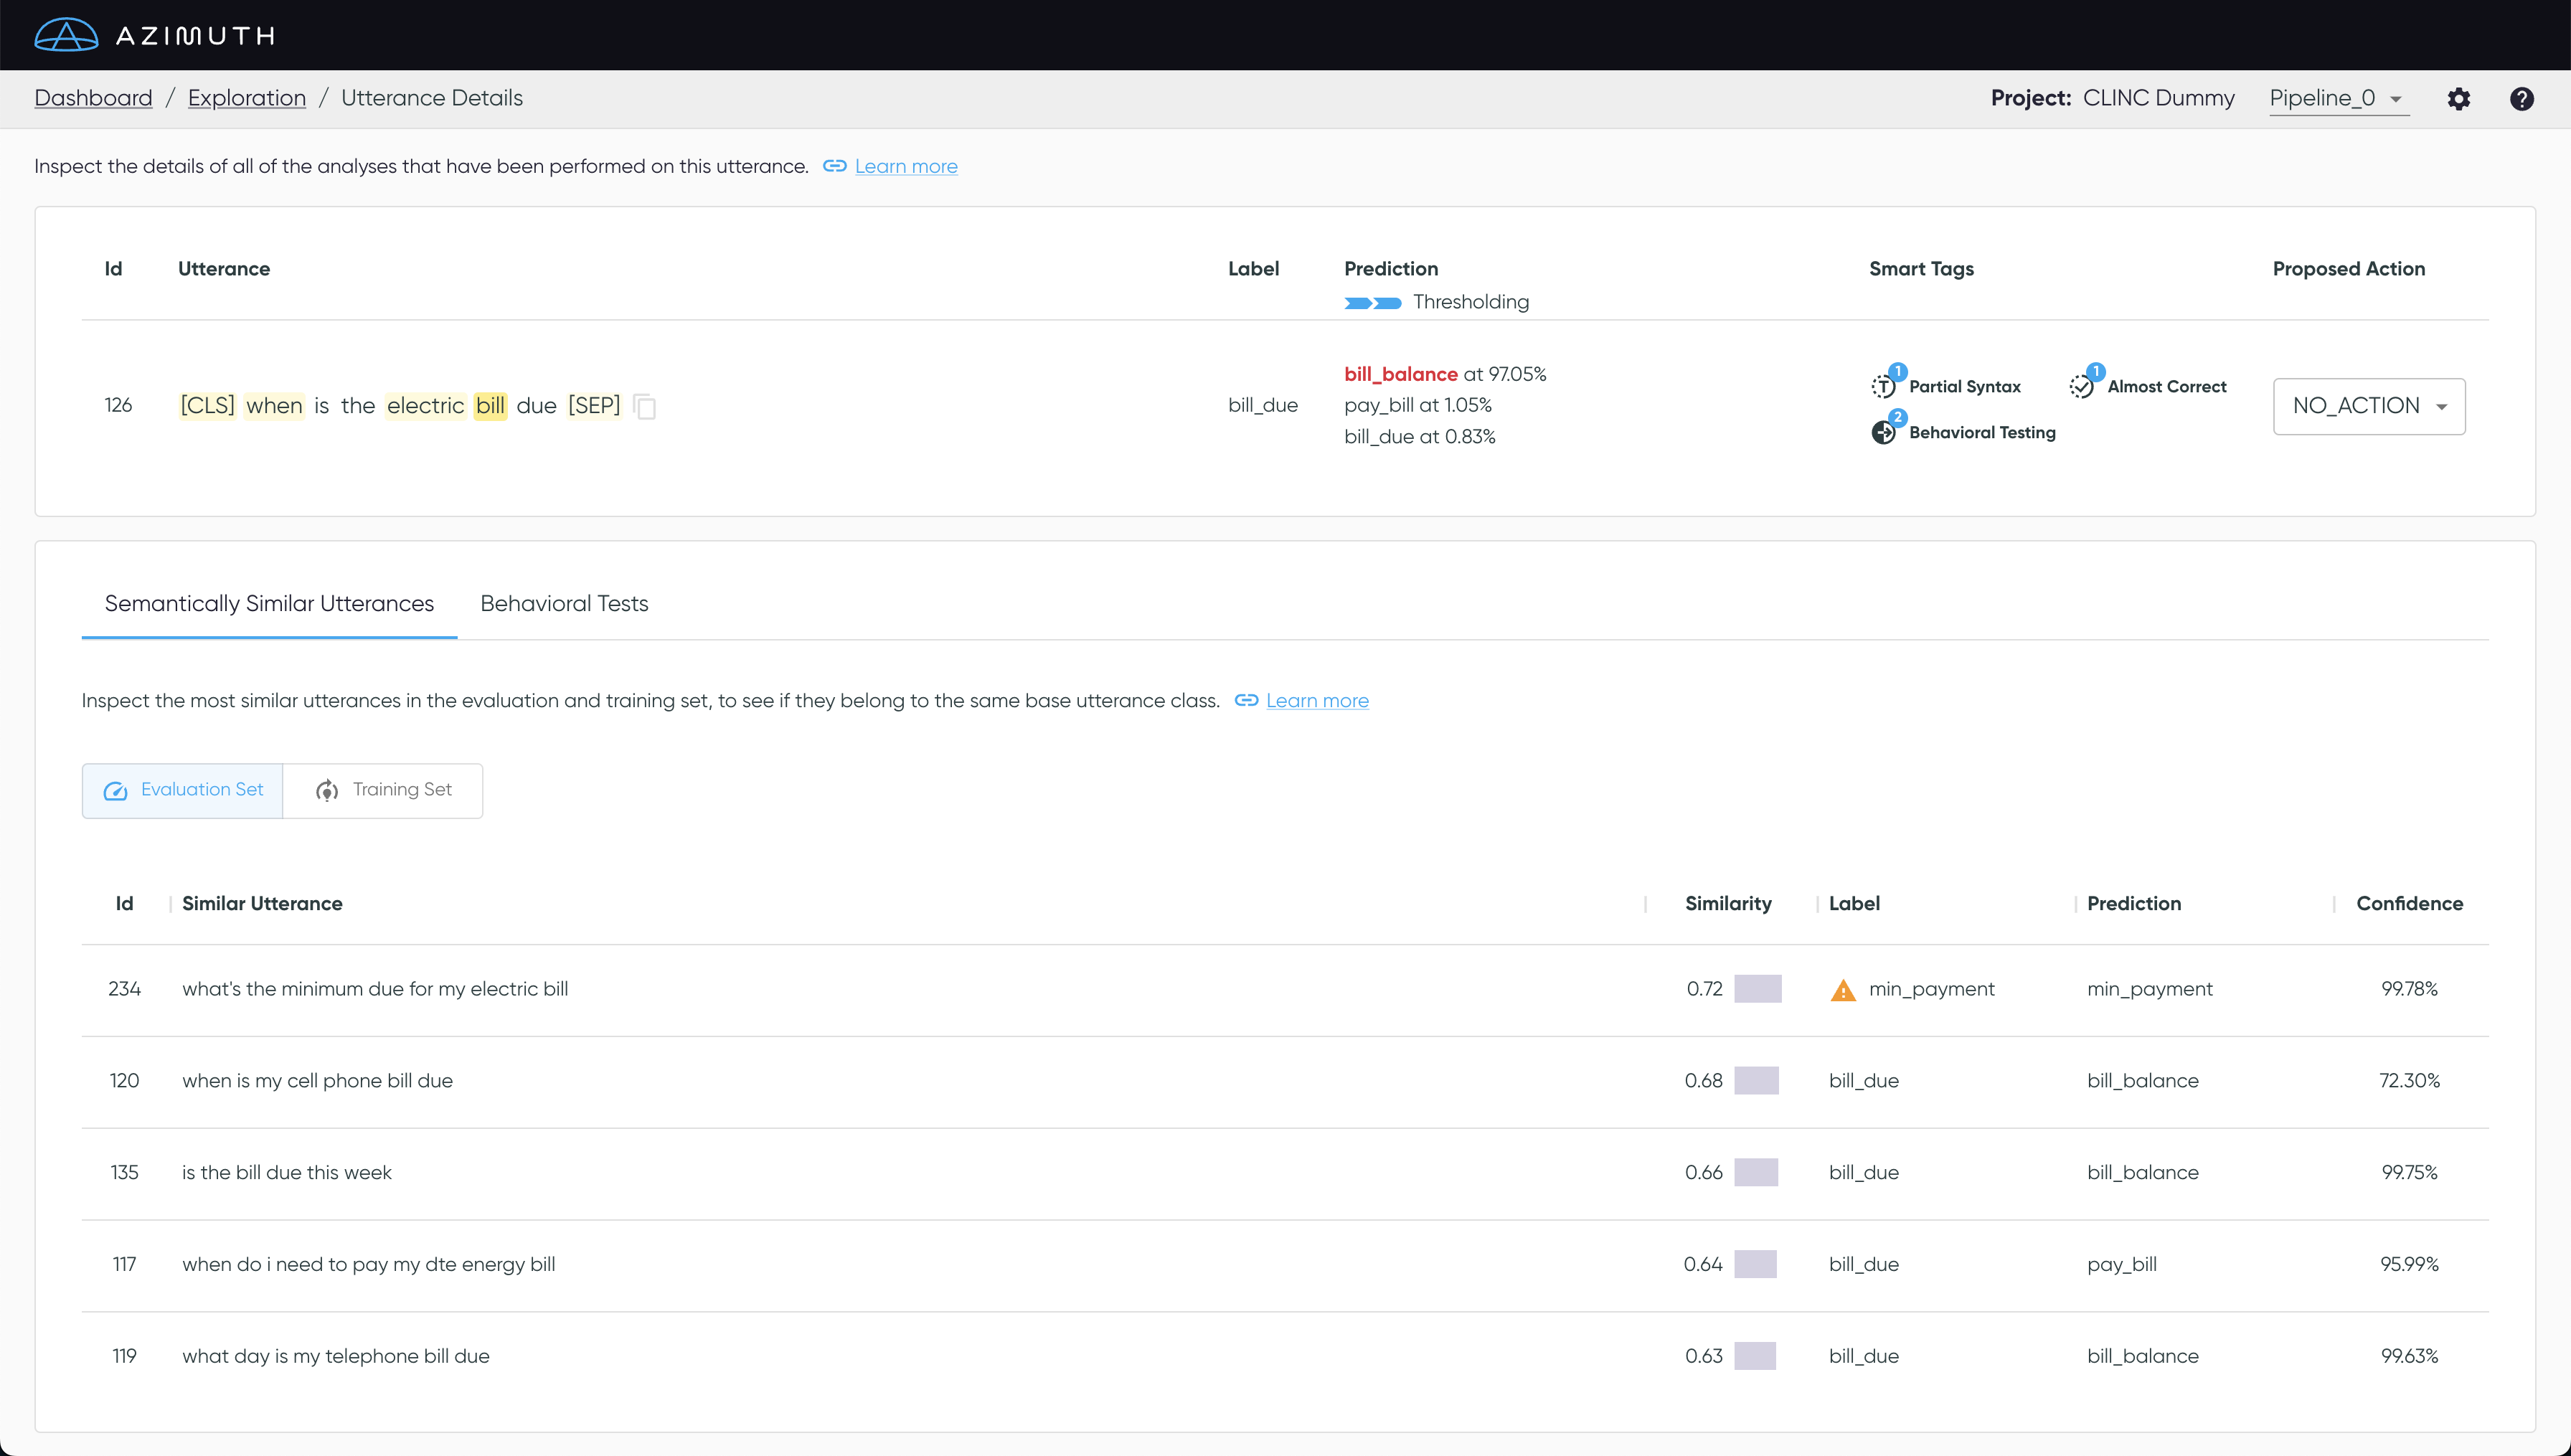
In Azimuth, the similarity analysis is used to derive Smart Tags, and also to show the most similar utterances in both dataset splits on the Utterances Details (see below).
Similarity is also used for class overlap, which assesses the semantic overlap between pairs of classes. Class overlap is presented in the Class Overlap Dashboard Section as well as the Class Overlap page.
How is it Computed?
Similarity Computation
To get utterance embeddings, Azimuth uses a sentence encoder (from sentence-transformers) based on a BERT architecture (Reimers and Gurevych, 20191). It then computes the cosine similarity (via a dot product on normalized embeddings) between each utterance in the dataset and all other utterances in both dataset splits (training and evaluation).
On the Utterances Details, the most similar examples are presented in descending order (i.e., most similar first), along with the cosine similarity to the selected utterance. A cosine similarity of 1 indicates that the utterance is identical, while 0 indicates that it is unrelated.
Smart Tag Family: Dissimilar
No Close Tags
Some utterances may have no close neighbors in a dataset split - that is, their most similar
utterances have low cosine similarities. When the cosine similarity of an utterance's closest
neighbor is below a threshold (default = 0.5), the utterance gets tagged with
no_close_train and/or no_close_eval, according to the dataset split being assessed (training or
evaluation). Note that this tag is class label-agnostic.
Conflicting Neighbors Tags
It can be useful to assess whether the most similar data samples to an utterance (its neighbors) come from the same or different classes. When most of its neighboring utterances are from a different class, it might indicate a mislabeling issue, overlapping classes, data drift, or simply a difficult utterance to predict.
Two Smart Tags highlight these sorts of utterances, based on
the label heterogeneity of the neighborhood in each dataset split (training or evaluation). If
90% or more of an utterance's most similar data samples (neighbors) in a dataset split belong to a
different class, it will be tagged as conflicting_neighbors_train
and/or conflicting_neighbors_eval, based on which dataset split is being examined. (E.g., an
utterance in the test set will be compared to its neighbors in both the training and evaluation
dataset splits.)
Class Overlap
Class Overlap Value
Class overlap is calculated using utterance embeddings, which are computed as described above.
Class overlap for class Ci (source class) with class Cj (target class) is defined as the area of the feature (embedding) space in which an utterance in class Ci has a greater probability of being in class Cj than in class Ci.
To approximate this probability, we make use of the
spectral-metric package
(Branchaud-Charron, 20192). The probability of a sample
being in a specified class is determined based on the representation of this class in the
sample's 5 nearest neighbors, as well as the hypervolume containing these neighbors (Parzen
window). Class overlap for the Ci with the Cj is calculated as the mean
probability across all samples in Ci. The similarity matrix S from spectral-metric
contains these probabilities for all class pairs. Note that probabilities are normalized by the
source class, to sum to 1.
Samples with overlap
Individual samples from a source class are determined to have overlap with a target class when their probability of being in the target class is greater than 0, which is the same as saying that at least one of their 5 nearest neighbors are from the target class. This is a conservative metric, on which we anticipate iterating in the future.
Configuration
Similarity Analysis Configuration presents language-based defaults for the encoder used for the embeddings on which similarity is computed, and details how to change this encoder as well as the two thresholds used to determine the smart tags.
-
Reimers, Nils, and Iryna Gurevych. "Sentence-bert: Sentence embeddings using siamese bert-networks." arXiv preprint arXiv:1908.10084 (2019). ↩
-
Branchaud-Charron, Frederic, Andrew Achkar, and Pierre-Marc Jodoin. "Spectral metric for dataset complexity assessment." Proceedings of the IEEE/CVF Conference on Computer Vision and Pattern Recognition. 2019. ↩